Goals
During this lab you will:
- Make a serial connection between your laptop and Pi and practice with
tio. - Learn how to use
riscv-unknown-elf-gdbin simulation mode and practice with gdb commands to step through code and examine registers and memory. - Implement a few simple C-string operations and use a combination of unit testing and gdb simulation to debug your work.
These exercises are useful preparation for the upcoming assignment to implement printf.
Prelab preparation
To prepare for lab, do the following:
- Be up to date on recent lecture content: C pointers/strings, uart, serial communication
- Read our guide to using gdb in simulation mode. Print out a copy of gdb quick ref to have on hand.
- Read our guide to uart and install tio.
- Organize your supplies to bring to lab
- Bring your laptop (with full battery charge) and entire parts kit.
Lab exercises
0. Pull lab starter code
Change to your local mycode repo and pull in the lab starter code:
$ cd ~/cs107e_home/mycode
$ git checkout dev
$ git pull code-mirror lab3-starter
1. Serial communication
1a) Loopback test
Find the usb-serial breakout in your parts kit. Set up for a loopback test by using a female-female jumper to connect TX straight back to RX, as shown in this photo:
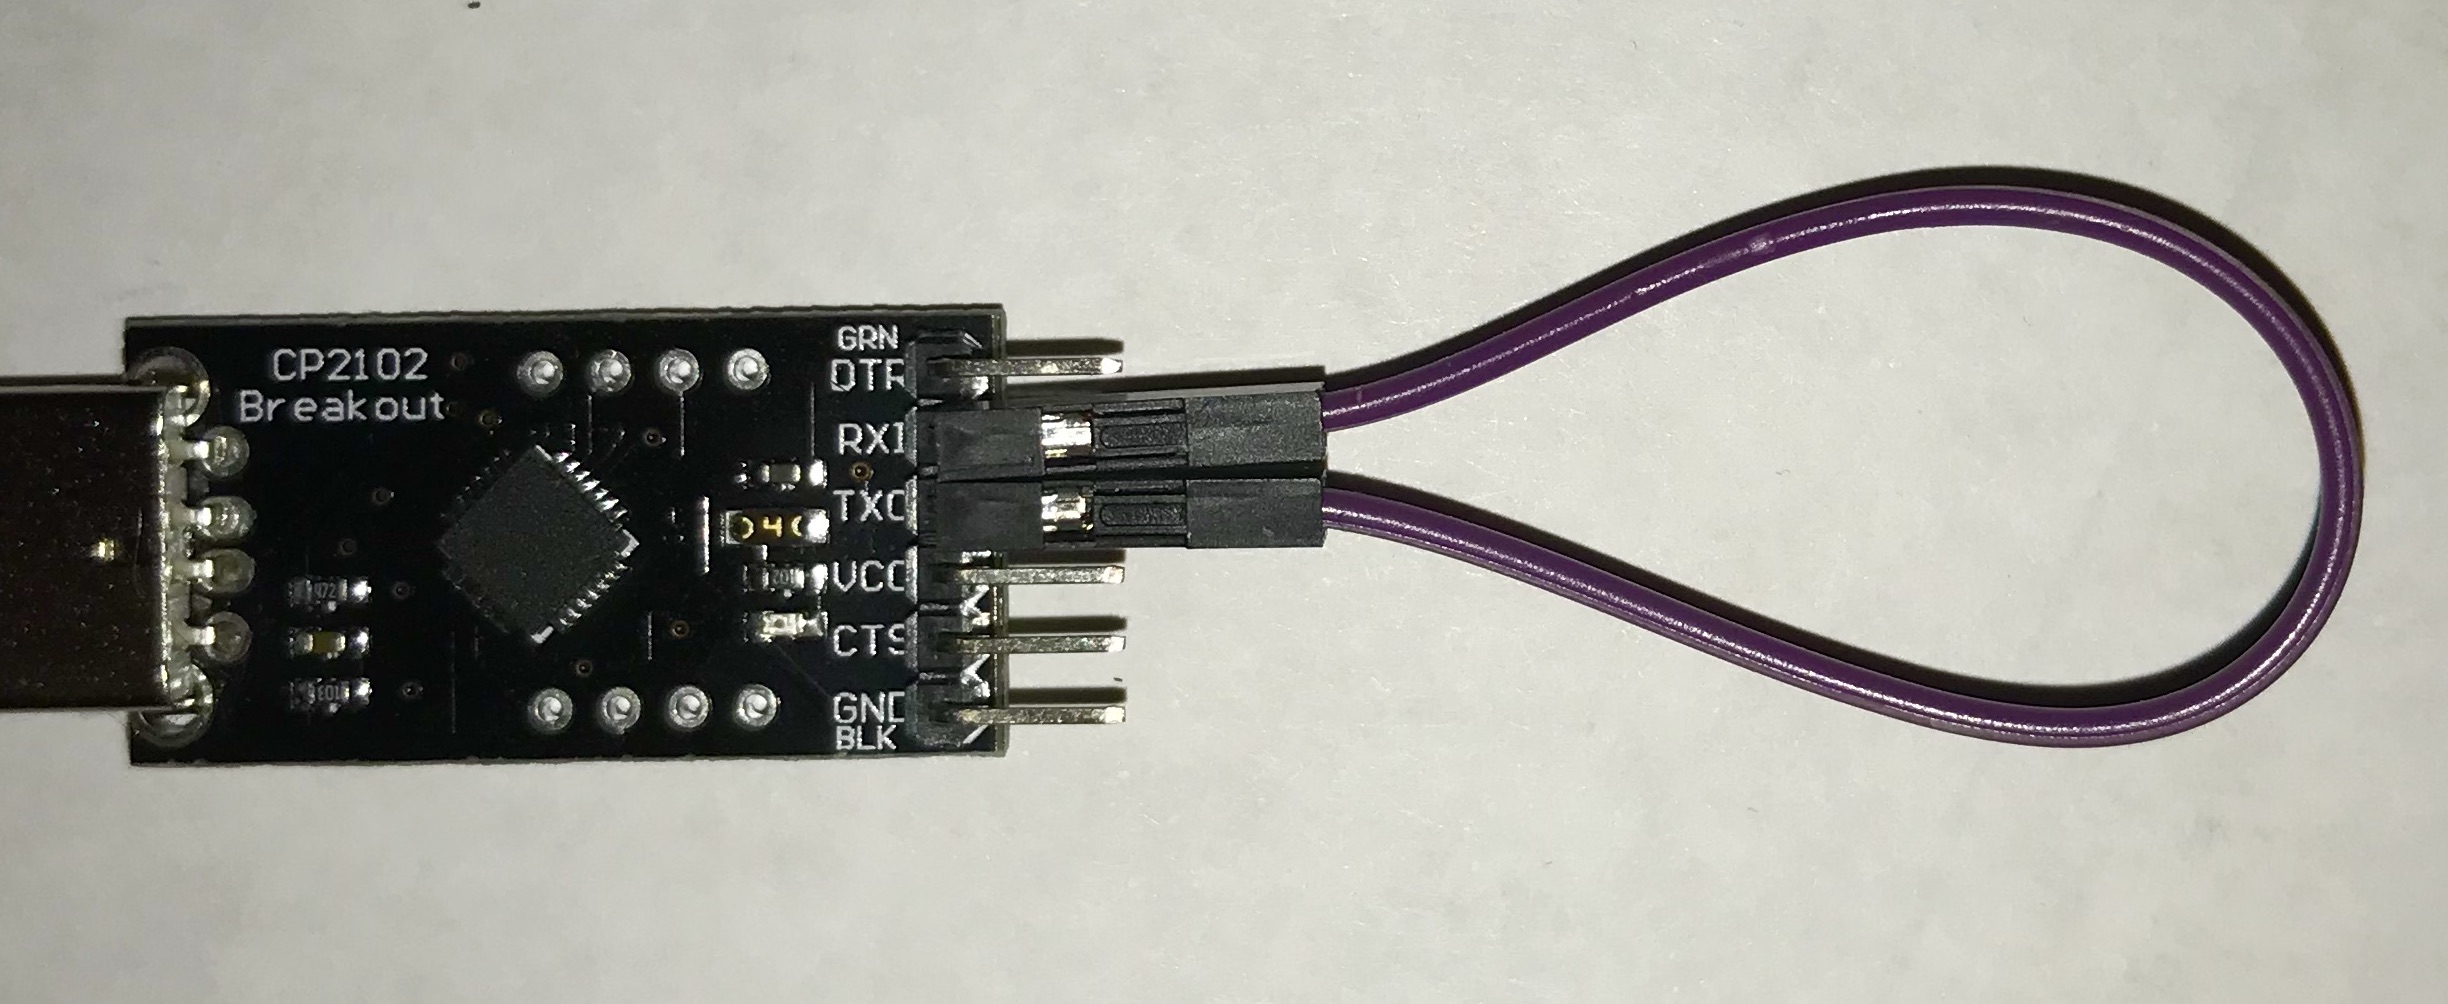
In loopback mode, the signals sent out on the TX pin are wired straight to the RX pin. Reading from the RX pin will read the characters sent over TX.
Insert the usb-serial into a USB port on your hub. Follow the instructions in uart guide to find the device name for your system. Open a tio connection to that device name (replace YOUR_DEVICE_NAME in command below):
$ tio /dev/YOUR_DEVICE_NAME
Type some characters in the tio window. They should be echoed by tio. Try manually sending a line feed LF by typing control-j (hold down control key and type j) and a carriage return CR by typing control-m. What is the difference in behavior of LF versus CR? When you type the enter/return key on your keyboard, does it seem to send a LF, a CR, or both?
Continue typing while your neighbor reaches over and gently disconnects one end of the loopback jumper. Where are the characters going now?
Reconnect the jumper and type some more. Your characters are echoed again.
You might think typing a character on a keyboard comes with an entitlement to seeing it drawn on the screen, but in fact, the tio program and the usb-serial device are essential components of that communication. When tio observes the typed character, it sends it out over the serial TX line, and it is listening on the serial RX line and echoing what it receives. In loopback mode, tio happens to be talking to itself, but it doesn't know this. If you disconnect the loopback jumper, characters are no longer echoed because they were never received.
When you connect the TX and RX of the usb-serial to the Mango Pi's uart, tio will instead be bridging the communication between your laptop and the Pi. Tio sends what you type to the Pi and displays what is received from the Pi. Neat!
(Fun aside for the curious: scoot your computer next to a buddy and use jumpers to connect the TX of your usb-serial to the RX of their usb-serial and vice versa, also connect the two grounds of the usb-serials. Now what happens when you type in your respective tio windows?)
You can exit tio by typing control-t q. However, you probably won't often quit and restart tio. Instead, open a separate window/tab for tio and keep it running at all times. In your other terminal window(s), you will be issuing commands, editing, building, etc. while the tio window maintains an open communication channel with the Pi. When you power-cycle or reset your Pi, tio will report a temporary disconnect and will automatically reestablish communication after reset.
1b) UART echo/printf test
Follow the instructions in uart guide to use jumpers to make a serial connection between your laptop and the Mango Pi.
Have tio running and connected. Initialize the Mango Pi dram by entering the xfel ddr d1 command in your shell window (not tio window), and see what is printed in your tio window!
$ xfel ddr d1
Interesting! When FEL is running, it has been transmitting diagnostic log messages on the serial line (PB8 and PB9) all along. Now that we have that channel open, we will hear what it's saying.
Change to the directory lab3/uart-printf.
$ cd lab3/uart-printf
$ ls
Makefile  hello.c
Review the code in hello.c. This program uses the uart_putstring function
to send characters from the Pi's TX pin.
$ make run
mango-run hello.bin
xfel ddr d1
Initial ddr controller succeeded
xfel write 0x40000000 hello.bin
100% [================================================] 132.055 KB, 341.767 KB/s
xfel exec 0x40000000
Over in your tio window, you should see this output:
hello, laptop
hello, laptop
hello, laptop
hello, laptop
hello, laptop
We <3 printf!
The uart module provides the basic function uart_putstring to output a string constant, but the fancier ability to output formatted strings comes with your implementation of printf. For example, the call printf("Today is %s %d\n", monthname, daynum)
inserts the month string and day number into the output. To learn more about how to use printf, check out the standard library printf documentation.
In Assignment 3, you will implement your own version of printf. With a working printf, your programs will be able to report on their state and super-charge your debugging. What a big improvement over trying to communicate everything using a single LED!
Open hello.c in your text editor and edit the main function to try out printf:
-
Add a
printfstatement inside the loop body to output the value ofion each loop iteration. -
After the loop, add a
printfstatement to output the value of*pb_config0in hex format with field width 8. -
Add code to configure GPIO_PB3 and GPIO_PB7 as output using
gpio_set_outputand printf*pb_config0again. -
Add code to reconfigure GPIO_PB3 and GPIO_PB7 as input using
gpio_set_inputand printf*pb_config0again.
Use make run and view the program's output. The print statements you added allow you to observe that gpio_set_function is correctly doing its job– neat!
You are ready to answer this check-in question. 1
2. Debugging with gdb
2a) Use gdb in simulation mode
This exercise is to practice using the gdb debugger in simulation mode.
A debugger allows you to observe and manipulate a running program and its program state.
Running a debugger on bare-metal hardware requires some complex infrastructure, so we instead will use
gdb on our local computer, running the program using the RISC-V emulation layer built-in to gdb.
gdb is an amazing power tool. Proficiency with gdb can improve a programmer's debugging efficiency by a factor of 10; in the hands of an expert, more like a factor of 100. The debugger gives you extensive
visibility into a program: when you know where to look, you can dig into
the ground truth of what is actually happening and how your code has gone astray. Mastering the debugger is just
as important as mastering your editor and compiler.
In this exercise, you'll walk through the basic features of gdb on an example program.
Change to the directory lab3/simple directory and review the code in simple.c.
Use the target make debug to build the simple.elf program and start it under
gdb. (Note that gdb reads the ELF file, not the raw binary file that we have been running on the actual Pi hardware.)
$ make debug
riscv64-unknown-elf-gdb -q --command=$CS107E/other/gdbsim.commands simple.elf
Reading symbols from simple.elf...
Each time you start gdb, you have to issue the same sequence of commands to configure the simulator, so we create a command file gdbsim.commands that is auto-loaded by the make debug target. These auto-loaded commands configure the simulator and load the program:
Auto-loading commands from $CS107E/other/gdbsim.commands...
Connected to the simulator.
Loading section .text, size 0x6a78 lma 40000000
Loading section .rodata, size 0x2958 lma 40006a78
Loading section .eh_frame, size 0x2c lma 400093d0
Loading section .data, size 0x1800 lma 40020000
Start address 40000010
Transfer rate: 352224 bits in <1 sec.
The start command will execute the program start sequence and stop at the first line of main.
(gdb) start
Temporary breakpoint 2 at 0x400000e8: file simple.c, line 30.
Starting program: lab3/code/simple/simple.elf

Temporary breakpoint 2, main () at simple.c:30
30  int main(void) {
(gdb)
When stopped, gdb prints the source line that is next to be executed. The next command executes
that line.
The command print d shows the value of d
after the call completes.
Temporary breakpoint 2, main () at simple.c:30
30 int main(void) {
(gdb) next
33     int d = diff(x, y);
(gdb) next
34     int f = factorial(7);
(gdb) print d
$1 = 74
(gdb) print f
$2 = <optimized out>
(gdb) next
35      int n = make_array();
(gdb) print f
$3 = 5040
Note that when gdb shows your program stopped at a line,
it is stopped before that line has executed. When stopped at line 34, the program is stopped before the call to
factorial. When we try to print f, it is not accessible because we have not yet executed the line where it is declared/initialized.
If we next over that line and then print f, we see its value.
Sometimes you isntead want to step into the code of the function being called.
To do this, use step instead of next. Put another
way, next executes the entire next line in the function
you're in, while step executes the next line of code,
which may be in a different function.
Use start to restart the program and again stop at main()
and then use step from there. The return/enter key(⏎) causes gdb to repeat the last command.
In the sequence shown below, each return does another step).
(gdb) start
Temporary breakpoint 3 at 0x400000e8: file simple.c, line 30.
Starting program: lab3/code/simple/simple.elf

Temporary breakpoint 3, main () at simple.c:30
30  int main(void) {
(gdb) step
33     int d = diff(x, y);
(gdb) ⏎
diff (a=a@entry=33, b=b@entry=107) at simple.c:27
27     return abs(b - a);
(gdb) ⏎
abs (v=v@entry=74) at simple.c:6
6      int result = v < 0 ? -v : v;
(gdb) ⏎
7       return result;
When stepping through code, gdb displays the next line of code to be executed. To see more context, use the list command:
(gdb) list
2   * Sample code to use as gdb practice.
3   */
4
5  int abs(int v) {
6      int result = v < 0 ? -v : v;
7      return result;
8  }
9
10 int factorial(int n) {
11     if (n <= 1)
Use continue to resume executing the program.
(gdb) continue
Continuing.
[Inferior 1 (process 42000) exited normally]
The above information tells you that the program has successfully run to completion.
When debugging a function, a common workflow is to
breakon the function in question.rununtil you hit the breakpoint.- Use
nextto step through each line of its code, usingprint,info locals,info regs, etc to examine state of variables and registers. - If the next line of code is a call to a function and you suspect the problem could be inside that call, use
stepto drop down into it. If younextthrough a call and realize that you wish you had usedstepinstead, userunto start over from the beginning and get another chance. - Recursively apply rules 2-3 until you find the bug.
2b) Use gdb to access stack frames
There are gdb commands that allow you to trace function calls and view stack frames. Let's try them out!
Set a breakpoint on the abs function. gdb reports the address of the instruction where it placed the breakpoint, in this case, address 0x40000024.
Use run to re-start the problem. It should stop when it hits the breakpoint.
(gdb) break abs
Breakpoint 4 at 0x40000024: file simple.c, line 6.
(gdb) run
Starting program: lab3/code/simple/simple.elf

Breakpoint 4, abs (v=v@entry=74) at simple.c:6
6       int result = v < 0 ? -v : v;
You are now stopped at the breakpoint on abs. The command disassemble with no arguments lists the assembly instructions in the context where the program is currently executing. The instruction marked =>is the next one to be executed.
(gdb) disassemble
Dump of assembler code for function abs:
=> 0x0000000040000024 <+0>:     sraw    a5,a0,0x1f
   0x0000000040000028 <+4>:     xor     a0,a0,a5
   0x000000004000002c <+8>:     subw    a0,a0,a5
   0x0000000040000030 <+12>:    ret
End of assembler dump.
Note that the first instruction of abs is at
address 0x40000024, which is the same address we saw previously.
We asked for a breakpoint on the function abs and gdb converted our request to 0x40000024 which corresponds to the address of the first instruction of abs.
Use the backtrace command to see the sequence of function
calls leading to here:
(gdb) backtrace
#0  abs (v=v@entry=74) at simple.c:6
#1  0x00000000400000dc in diff (a=a@entry=33, b=b@entry=107) at simple.c:27
#2  0x0000000040000104 in main () at simple.c:33
#3  0x0000000040000170 in _cstart () at reference/cstart.c:22
#4  0x0000000040000020 in _start ()
The backtrace shows abs was called by diff
on line 27, which in turn was called by main at line 33. The
numbers on the left refer to the frame. The innermost frame is
numbered 0, and corresponds to the currently executing function, in this case, abs. The frame of its caller has a higher number and so on, up to the highest numbered frame which is outermost. This outermost frame is where the program execution started.
The info frame command prints a summary of the current stack frame:
(gdb) info frame
Stack level 0, frame at 0x4fffffc0:
 pc = 0x40000024 in abs (simple.c:6); saved pc = 0x400000dc
 called by frame at 0x4fffffd0
 source language c.
 Arglist at 0x4fffffc0, args: v=v@entry=74
 Locals at 0x4fffffc0, Previous frame's sp is 0x4fffffc0
The info locals and info args commands give more information about the frame's arguments and local variables:
(gdb) info args
v = 74
(gdb) info locals
result = <optimized out>
gdb lets you choose which frame on the call stack you wish to inspect.
The command up selects the frame that is one step up the call stack (e.g. frame of caller) and down moves back to callee.
(gdb) up
#1  0x00000000400000dc in diff (a=a@entry=33, b=b@entry=107) at simple.c:27
27     return abs(b - a);
(gdb) info args
a = 33
b = 107
(gdb) info locals
No locals.
(gdb) down
#0  abs (v=v@entry=74) at simple.c:6
6      int result = v < 0 ? -v : v;
(gdb) info args
v = 74
Another useful info command is info reg which displays the contents of the registers.
(gdb) info reg
ra             0x400000dc   0x400000dc <diff+16>
sp             0x4fffffc0   0x4fffffc0
gp             0x0  0x0
tp             0x0  0x0
t0             0x0  0
t1             0x0  0
t2             0x0  0
fp             0x50000000   0x50000000
s1             0x13b0   5040
a0             0x4a 74
a1             0x6b 107
a2             0xfffffffffffff0ff   -3841
a3             0x40000  262144
a4             0x40000  262144
a5             0x2000090    33554576
a6             0x0  0
a7             0x5d 93
s2             0x0  0
s3             0x0  0
s4             0x0  0
s5             0x0  0
s6             0x0  0
s7             0x0  0
s8             0x0  0
s9             0x0  0
s10            0x0  0
s11            0x0  0
t3             0x0  0
t4             0x0  0
t5             0x0  0
t6             0x0  0
pc             0x40000024   0x40000024 <abs>
What value is currently in a0? Why does a0 contain that value? (Consider: at what point in the program execution are we stopped right now? What was the last use of a0?) What value is in a1?
You can access a single register by using the syntax $regname, e.g. $a0.
(gdb) print $a0
$4 = 74
Now it's your turn to get additional practice with tracing and observing function calls. Review code for the factorial and make_array functions.
The factorial function operates recursively. Set a breakpoint on factorial so gdb will stop on each recursive call. Use continue to continue the program. Each new call to factorial will stop at your breakpoint. Use backtrace each time to see how the stack changes as you get deeper into the recursion. Try moving up and
down and use info frame and info args to view individual stack
frames. Note how each invocation has its own distinct copy of the parameter n.
The function make_array demonstrates how the stack is used
for storage of local variables. A local variable of size 64 bits or fewer is typically stored in a register without the overhead of writing to stack memory. Larger data
structures, such as arrays and structs, that do not fit in a register must be stored on the
stack. Use break simple.c:22 to set a breakpoint on line 22, in the loop body within the make_array function. When stopped at the breakpoint, use disassemble to review the instructions in the function prolog that set up the stack frame. Ask gdb to print the address of i &i, then print &array[0]. Compare that address to the current value of the $sp register.
Use info locals to see the array contents at the function start. Are
the array elements initialized to any particular value? Step through
the loop a few times and use info locals to see how the array is
updated.
The goal of all this mucking about in gdb is to solidify your understanding the mechanics of function calls and the runtime stack. If there are portions you don't yet understand, ask your tablemates or the staff to resolve those questions now.
Now introduced to gdb, you'll want to incorporate it into your development process and to practice until you become comfortable and fluent. Tracing in gdb helps you learn more about the translation between your C code and the generated assembly, and being able to observe and manipulate your program while it is executing will be an invaluable aid when tracking down bugs.
In software development, only a small fraction of your time goes into writing the code, the rest is taken up in testing and debugging. Honing these skills to build up your debugging superpowers will pay off many times over!
You are ready for this check-in question2
3. C-strings
For this exercise, you will work with C-string functions and get further practice with unit-testing and debugging.
Change to the lab3/cstrings directory and open the cstrings.c
file in your editor.
Pampered programmers who work on hosted systems are provided with functions such as strlen and strcpy as part
of the standard library, but in the bare-metal world, we must implement these operations ourselves.
The first string operation to look at is strlen. This function returns the count of characters in a C-string. The function operates by iterating through the sequence of characters until it finds the null terminator that marks the end.
Review the given (correct) code for strlen in cstrings.c. It uses array subscripting on a variable declared as a pointer. What does it mean to access the nth array element of a pointer variable? Is the null terminator included in the count that is returned?
The code for strlen is simple enough that you might feel confident calling it correct "by inspection", but let's use our unit testing strategy to truly confirm the behavior of the executing function.
Read through the test cases in the test_strlen.
Compile the program and run it on the Pi using make test. Your test program should successfully run to completion. It is a correctly-implemented strlen function, as advertised.
Now, let's move on the strcpy operation. This function copies the characters from one string to another:
char *strcpy(char *dst, const char *src);
Functions in the standard library each have a man page that documents the function's use and behavior. Bring up the man page for strcpy.
$ man strcpy
Read the man page and then try implementing strcpy yourself. Does strcpy copy only the non-null characters or is the terminator included? If you're not sure, read the man page to confirm the expected behavior.
When you are ready to test your strcpy, review the test cases in the test_strcpy function. Uncomment the call to test_strcpy in main(). Use make test to rebuild the test program and run it on the Pi.
If you get the blue flash of doom, dig in to find out what's gone wrong and work to resolve the issue. Don't move on until all tests pass and you earn the peace and quiet from your Pi.
4. Gdb and testing
You can also test a program by running within gdb in simulation mode. Let's try that now on the cstrings program.
Debug strlen
Edit strlen to intentionally plant a bug, such as changing the function to always return 7. This will cause test failures in test_strlen. Use make test to build the test program and run on the Pi and you get the flashing LED that indicates a failed assert.
Let's learn how that failed assert is presented under the debugger. Use make debug to get the buggy program under gdb and run it. There is no flashing light; the simulator is not talking to your Pi nor its peripherals. Your Pi doesn't even need to be connected!
What do you see in gdb? There is output announcing the failed assertion and then the program exits.
(gdb) run
Starting program: lab3/code/cstrings/cstrings.elf
File cstrings.c, line 26, in function test_strlen() : Assertion 'strlen("green") == 5' failed.
[Inferior 1 (process 42000) exited with code 01]
Look we learn that the failed assertion occurred on line 26 of the cstrings.c file (your code may be on a nearby line number, depending on how long your strcpy implementation was). Use list to see that code now:
(gdb) list cstrings.c:26
22
23  void test_strlen(void) {
24      char *fruit = "watermelon";
25
26      assert(strlen("green") == 5);
27      assert(strlen("") ==  0);
28      assert(strlen(fruit) == 2 + strlen(fruit + 2));
This allows us to pinpoint exactly which assert failed (rather than have to comment-in-and-out tests one by one to find it). Hooray for gdb!
Restore strlen to its correct implementation, rebuild and run again under the debugger. All tests should pass, no report of failed assertion, and gdb reports that the program "exited normally".
(gdb) run
Starting program: lab3/code/cstrings/cstrings.elf
[Inferior 1 (process 42000) exited normally]
(gdb)
Tip If your program appears to be unresponsive or you just want to stop the program and poke around, type
control-cto interrupt the executing program and return control to gdb. Usebacktraceto see where the program was executing when it was interrupted.
Learn to recognize these two common situations:
- a successful run to completion that exits normally
- a failure that halts the program at the point of the failed assertions
Debug bogus_strlen_calls
Both strlen and strcpy have been shown to work correctly for valid calls. We are now going to do a little exploration into what happens
for calls that misuse the functions.
Review the code in the aptly-named bogus_XXX functions.
Get together with your tablemates and look at the three "bogus" calls.
For each consider why it is invalid: what is improper about the C-string that is being passed as the argument?
The string functions in the standard C library are not robust against a bad call that asks the function to read or write invalid memory. The reason for this is not for performance or
due to laziness – it's actually not possible for strlen to verify that its argument is a valid C-string. A char* is
not necessarily a pointer to a string – it could be just a pointer
to a single character. Furthermore the address might not have a char pointee at all – it could be an int stored there or the address might be completely invalid or contents uninitialized. The C language does not have a reliable means to determine the validity of a pointer and reject the bad ones.
Uncomment the call to the first bogus test in main(). Use make test to run on the Pi and note whether it passes or fails the assert. Now use make debug to run in gdb under the simulator. Do you observe same behavior under gdb (i.e. same pass/fail of assert)? In gdb, you can single step through the call and observe the behavior of strlen on the bad call. Is the result what you anticipated?
Repeat for the second and third bogus tests. Each time, note whether the gdb simulator has the same behavior as when running on the actual hardware and use single step in gdb to observe what is happening. What did you learn from this about the observed consequences of reading uninitialized or invalid memory? Confirm you understanding with this check-in question3
The dangers of C-strings
The fact that a C-string depends on a properly-placed null terminator to mark the end puts the responsibility squarely on the programmer's shoulders. If your code forgets to write the terminator or allocates a too-small amount of space and writes too many characters to it, there will be no helpful compile-time error to warn you. The compiler will generate assembly code to do what you asked and at runtime, those instructions will be executed, even if that means walking past the end of the string and accessing/overwriting the neighboring memory. Ouch! For example, consider this code:
struct request {
  char *filename;
  char *host;
};

void process_request(struct request *request) {
  char filename[128];
  strcpy(filename, request->filename);
  read_file(filename);
}
This code might seem contrived, but it's similar to what a lot of web server code
looked like in the early 2000s. Recall from lecture that variables allocated inside
functions are put on the stack: filename is an array of 128 bytes on the stack.
Talk with your neighbor: what happens if request->filename is longer than 128 characters?
What will the call to strcpy do?
How might this cause software to fail or act unpredictably? If this code existed in a critical context, could it cause a serious failure? It's useful to note that that
the git codebase (source code for the git program itself) bans the use of strcpy. Instead, you always are supposed to use strncpy, which has an explicit maximum
length for copying; e.g., this code limits the copying to only what fits in the stack array:
struct request {
  char *filename;
  char *host;
};

void process_request(struct request *request) {
  char filename[128];
  // one fewer to make sure there's space for a \0
  stnrcpy(filename, request->filename, sizeof(filename) - 1);
  filename[sizeof(filename) - 1] = '\0';
  read_file(filename);
}
Differences under simulation
It is important to be aware of the discrepancies you may observe when comparing the behavior of a program running on the Pi versus running under the gdb simulator. Read the section titled Differences due to simulation in our gdb guide to be introduced to some of the issues you may run into.
Change to the directory lab3/simulator directory and review the program in the buggy.c file Trace through the operation of the program. What do you predict will be printed as output?
Be sure that your usb-serial is connected and your tio window is ready. Use make run to run the program on the Pi. Does the output printed in the tio window match what you predicted? Use make run to run the program a second time and then a third. When the output of the subsequent runs appears affected by the previous, showing the carryover of values in DRAM being persisted over a "warm reboot". Disconnect your Pi from power, wait 5 or 10 seconds, reconnect and make run again. What output do you get on a "cold boot"?
Now load the same program into gdb simulator using make debug and use run inside gdb to execute on the simulator. The program has a different output under the simulator than it did when running on the Pi. Use run a few more times to see the output from subsequent runs. Does it have the same output each time or do you see carryover effects from the previous run? Can you explain the differences you see when running under the simulator versus running on the Pi?
When your code works on one but not the other or has different outcomes under the simulator versus on the Pi, it almost certainly indicates that the code has a bug. A likely root cause to look for is an incorrect access to memory (uninitialized or out of bounds).
The gdb simulator is a powerful addition to your toolbox, but it is important to understand its limitations and differences from an actual Pi. 4
Check in with TA
The key takeaways from this lab are to confirm a working serial connection and a basic understanding of gdb and eagerness to learn more. Please touch base with us during lab to ask your questions and confirm your understanding.5
Lab 3: Debugging and Testing
Circle lab attended: Tuesday Wednesday
Fill out sheet and jot down questions/issues that come up. Check in with us along the way, we are here to help!6
-
Show us the serial connection between your laptop and your Pi communicating via
tio. This will be your permanent setup from here forward (keep your usb-serial always connected andtiowindow always open). When packing the Pi into your kit box, tuck it in with the usb-serial connected. ↩ -
Which gdb commands are you already feeling comfortable with? Which others do you plan to learn more about? ↩
-
On a hosted system, a bogus call to
strlen(e.g. invalid address, unterminated string) may crash/halt at runtime. But running bare-metal on the Pi, every call tostrlen(whether well-formed or not) will complete "successfully" and return a value. Explain why this difference in behavior. What value is returned from an erroneous call? ↩ -
Given that the gdb simulator is not an exact match to the actual Pi hardware, it is possible for a program to exhibit a bug on the Pi, but looks "fine" under the simulator or vice versa. What underlying difference(s) between simulator and real thing might contribute to this inconsistency? ↩
-
Are there any tasks you still need to complete? Do you need assistance finishing? How can we help? ↩
-
Do you have any feedback on this lab? Please share! ↩